Introduction
A shift supervisor walks the injection molding floor at 6 AM for handoff. The question is simple: "Are we on track?" The answer shouldn't require hunting down paper logs from the previous shift — but for most plants, that's exactly what happens.
Without live visibility into machine cycles, reject rates, and stop events, output losses accumulate quietly. An hour of undetected downtime becomes two. A process drift that could have been caught at one bad shot becomes an entire batch of rejects. According to Siemens' 2024 True Cost of Downtime report, the average recovery time per downtime incident rose from 49 minutes in 2019 to 81 minutes in 2024 — the window between detecting a problem and resuming production keeps expanding.
This guide covers what real-time production monitoring systems are, how they work, the benefits they deliver, and what injection molding operations should specifically look for when evaluating one.
Key Takeaways:
- Real-time monitoring converts live machine signals into actionable dashboards and alerts — no manual reporting lag
- OEE (Availability × Performance × Quality) is the master metric most systems are built around
- Legacy presses can be retrofitted with sensors and gateways — no full equipment replacement required
- Robots like Yushin's FRA Series with INTU LINE IoT serve as both production assets and live monitoring data nodes
- Start with a pilot on one line or cell before committing to plant-wide rollout
What Is a Real-Time Production Monitoring System?
A real-time production monitoring system is a technology platform that continuously collects data from machines, sensors, and operators on the shop floor, then converts those raw signals into visible, actionable metrics without the lag of manual reporting.
Two functions define the category:
- Building an accurate, live data foundation from equipment signals, controller outputs, and operator inputs
- Transforming that data into information decision-makers can act on right now, not at the next shift meeting
OEE: The Master Metric
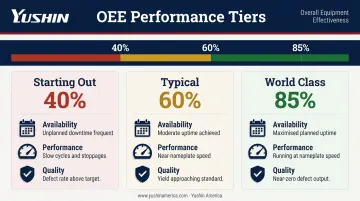
Most monitoring systems are built around Overall Equipment Effectiveness (OEE) — the percentage of planned production time that is truly productive. OEE is calculated from three components:
- Availability — actual run time vs. planned production time
- Performance — actual output speed vs. ideal speed
- Quality — good parts vs. total parts produced
According to Lean Production, 85% OEE is world class for discrete manufacturers, while 60% is fairly typical and 40% is common for operations just starting to track performance. Tracking all three components simultaneously gives a complete picture that no single metric provides alone.
Real-Time Monitoring vs. Traditional Production Logging
| Approach | Data Availability | Response Window |
|---|---|---|
| Paper logs / end-of-shift reports | Hours after the event | Next shift or next day |
| Manually entered spreadsheets | Hours to days | Reactive, after losses accumulate |
| Real-time monitoring platform | Seconds to minutes | While the issue is still containable |
The Manufacturing Leadership Council reported in 2024 that 70% of manufacturers still collect data manually, which means most operations are making decisions on information that's already stale by the time it's reviewed.
Machine Monitoring vs. Production Monitoring
These terms are often used interchangeably, but the scope is different:
- Machine monitoring zeroes in on individual equipment health: speeds, temperatures, cycle counts, and fault codes. Use it to diagnose and maintain a specific asset.
- Production monitoring takes a plant-level view, combining data from multiple machines, operators, and workflows to evaluate output, quality, and efficiency across entire lines.
The distinction comes down to which question you need answered: "What's wrong with press 7?" calls for machine monitoring. "How is the second shift performing against plan?" calls for production monitoring. Knowing which lens to apply prevents you from buying the wrong tool for the problem.
Key Benefits of Real-Time Production Monitoring
Reduced Unplanned Downtime
When anomalies trigger instant alerts rather than being discovered at the next manual check, maintenance teams respond while the issue is still contained. The Siemens 2024 report found that firms prioritizing real-time visibility and predictive maintenance approaches achieved significantly better OEE than those without such strategies.
Shorter detection time means shorter recovery time — and less lost output per incident.
Improved Quality Control
Real-time monitoring catches deviations in cycle parameters — speed, pressure, temperature, reject rate — the moment they cross a defined threshold. Operators can intervene before a full batch is compromised.
A Plastics Technology study found that univariate SPC monitoring can generate 29 false alarms per 1,000 observations for every 10 variables added — while multivariate analysis maintains stable alarm rates regardless of variable count. Monitoring multiple molding variables together, rather than isolated single-parameter alarms, produces more reliable quality signals.
Faster, Data-Driven Decisions
Live dashboards eliminate the "I'll check the logs" delay. A supervisor can see at a glance whether the current shift is winning or losing against target — and make staffing, scheduling, or maintenance calls based on what's actually happening, not what was documented hours ago.
Better Resource Allocation
When monitoring data reveals which machines, shifts, or lines are underperforming, operations managers can direct technicians, materials, and changeover time where they have the highest impact — rather than spreading effort evenly across all assets regardless of actual performance.
Foundation for Continuous Improvement
Historical monitoring data creates the trend visibility needed for structured improvement initiatives. Teams can use that data to:
- Compare shift-over-shift and week-over-week performance
- Validate whether a process change actually moved the needle
- Prioritize top recurring losses for focused Kaizen or TPM projects
How Real-Time Production Monitoring Works
The Data Collection Layer
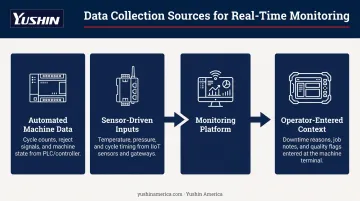
Monitoring systems gather signals from three primary sources:
- Automated machine data — PLC outputs, controller signals, and part counters pushed directly from equipment with built-in connectivity. No manual logging, minimal human error, immediate accuracy.
- Sensor-driven inputs — external IIoT sensors (proximity, vibration, current) attached to legacy equipment that lacks native connectivity. A 2022 systematic review found gateways used in 88% of digital-retrofit solutions and OPC UA in 75% of reviewed retrofitting papers, making this a well-established path for older presses.
- Operator-entered context — tablets or floor terminals where workers log the reason for a stop ("tooling issue" vs. "material shortage"). This converts raw downtime data into root cause detail — distinguishing a tooling failure from a material shortage — that sensors alone cannot capture.
The Processing and Visualization Layer
Collected signals are processed into:
- Live scoreboards on the shop floor showing target vs. actual counts for operators
- Supervisory views displaying OEE components by line or cell
- Management-level summaries covering plant-wide trends and shift comparisons
- Trend reports for strategic review and structured improvement initiatives
Alert and Escalation Mechanisms
Visualized data only creates value if the right person acts on it. Effective systems automatically notify operators, supervisors, or managers — via screen alert, email, or mobile notification — when a threshold is breached. Common triggers include:
- OEE drops below a defined floor
- A machine has been stopped longer than a set interval
- A reject rate crosses a quality threshold
If an operator doesn't acknowledge an alert within a defined window, the system escalates to their supervisor automatically. This is especially critical for lights-out or minimally staffed shifts where no one is physically watching each press.
Must-Have Features in a Production Monitoring System
Live Dashboards with Role-Based Views
Different stakeholders need different information:
- Floor operators — real-time scoreboard showing target vs. actual counts and current machine status
- Shift supervisors — OEE components by line, stop event logs, quality alerts
- Plant managers — plant-wide trends, shift comparisons, top losses by category
Each view should surface only what that role needs — no filtering required.
Automated Alerts and Escalation
Configurable threshold-based notifications should trigger without human intervention. Look for:
- Customizable alert conditions per machine or line
- Escalation logic (if operator doesn't respond in X minutes, notify supervisor)
- Multi-channel delivery (screen, email, mobile)
- Programmable response behavior — some conditions warrant stopping; others warrant alerting while continuing to run
Historical Data Access and Reporting
Live dashboards show you what's happening now. Historical reporting tells you why it keeps happening — and that's where most plants find their biggest improvement opportunities. The system should archive data to support:
- Shift-over-shift and week-over-week comparisons
- Root cause investigation for recurring losses
- Audit documentation and compliance records
- Validation that process changes actually improved performance
Integration with Existing Equipment and Systems
The monitoring platform must connect to machines already on the floor without requiring a full infrastructure overhaul. Common connection methods include:
- OPC-UA — The OPC Foundation describes OPC UA as a platform-independent architecture enabling interoperability across machines from different manufacturers; for injection molding plants running mixed-brand equipment, OPC UA compatibility prevents vendor lock-in
- PLCs and direct sensor inputs — for machines with existing control infrastructure
- API integrations — for connecting to ERP/MES systems already in use
- External sensors or IoT gateways — for legacy equipment that lacks native connectivity
Legacy compatibility matters. A system that only works with the newest presses leaves most of the floor invisible.
Real-Time Monitoring in Plastic Injection Molding
Injection molding is a natural fit for automated monitoring: every machine cycle is a discrete, measurable event. Shot count, cycle time, reject rate, cooling time — all of these generate data continuously. Even small deviations in cycle time compound into significant output losses across a multi-machine operation.
Plastics Technology has estimated that approximately 80% of North American plastics plants are still "blind" due to continued reliance on paper-based data — a gap that represents significant competitive exposure as molding operations face tighter margins and shorter lead times.
Key KPIs for Injection Molding Operations
| KPI | Why It Matters |
|---|---|
| Cycle time vs. target | Deviations compound across cavities and shifts |
| Scrap/reject rate per job | Catches process drift before batch-level losses |
| Machine availability (planned vs. unplanned downtime) | Core OEE input; drives scheduling decisions |
| OEE by press | Identifies which assets need attention first |
| Take-out robot cycle confirmation | A robot stop halts the entire cell |
| Shot count per press | Baseline for output and efficiency tracking |
Tracking downstream automation — not just the press itself — is critical. On ultra-fast cells like those running Yushin's HSA (sub-5-second cycles) or TSXA (sub-3-second IML cycles), a failed take-out confirmation can mean mold damage or hundreds of rejected parts per minute. Cycle confirmation at the robot level is as important as monitoring the press.
Yushin's Monitoring Capabilities
Yushin America's FRA Series robots come standard with INTU LINE IoT — a cellular-connected, cloud-based monitoring platform that captures production counts, uptime ratios, cycle times, error tallies, and short stoppage logs. INTU LINE operates independently of the plant's internal IT network (no LAN cabling, no IT integration required) and is accessible from any smartphone or PC. The short stoppage visibility is valuable — minor stops that don't register as full downtime events are often the largest hidden OEE losses in a molding operation.
For plants running YC or YCII series robots in lights-out or minimally staffed conditions, the YC Email Notification Module provides automated email alerts for up to 8 programmable error types — including take-out failures, E-stop events, conveyor-full conditions, and inserts-empty alerts.
Alerts reach any mobile device or Windows platform, meaning a technician on call at 2 AM gets notified immediately when a press goes down — without requiring anyone on the floor. The module is available as a new installation or as a retrofit on existing YC/YCII robots.
Together, INTU LINE and the Email Notification Module give molding operations continuous visibility at the machine level — the foundation for reducing unplanned downtime and sustaining lights-out production.
Steps to Implement a Real-Time Production Monitoring System
1. Assess Infrastructure and Connectivity
Audit what machines are on the floor:
- Which presses have native connectivity (PLC outputs, controller signals)?
- Which require external sensors or IoT gateways?
- Does existing network infrastructure support the monitoring platform, or is cellular-based transmission (like INTU LINE) a better fit?
This step prevents costly surprises during deployment and clarifies the true scope of the project before any purchase decisions are made.
2. Start with a Pilot and Define Clear KPIs
Begin with one line or one cell. Set specific, measurable targets — for example, OEE improvement by a defined number of points within 90 days. A narrowly defined first phase:
- Validates data accuracy before plant-wide rollout
- Surfaces integration issues on a manageable scale
- Builds internal confidence and stakeholder buy-in
- Gives the team time to develop review routines around the new data
3. Train the Team and Build Ownership
Operators need to understand what dashboards mean and why their inputs — logging downtime reasons, confirming completions — directly affect data quality across the plant. Without that understanding, data collection becomes inconsistent, and the system loses value fast.
Supervisors also need structured review routines to act on what the data reveals:
- Shift handoff reviews to transfer context between teams
- Daily loss meetings to address recurring downtime causes
- Weekly trend discussions to spot patterns before they compound
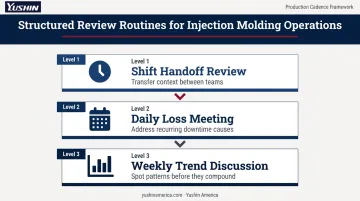
Without those routines, even accurate live data sits unused.
Frequently Asked Questions
What is a real-time monitoring system?
A real-time monitoring system collects data from machines, sensors, and operators as events happen and immediately converts those signals into visible metrics, alerts, and dashboards. Teams can identify and respond to issues as they occur rather than discovering them hours later in a paper log.
How does real-time monitoring work?
Sensors, machine controllers, or operator terminals capture production data continuously. Monitoring software processes that data and displays it on dashboards, triggering automated alerts when thresholds are crossed — so the right people are notified immediately, without manual intervention.
What is an example of a real-time monitoring system?
A plant floor OEE dashboard connected to injection molding machines — showing live cycle counts, current OEE by press, and automated stop alerts — is a common example. Yushin's INTU LINE IoT (FRA Series) and YC Email Notification Module (YC/YCII Series) provide this alerting and visibility function for take-out robot cells.
What is the difference between machine monitoring and production monitoring?
Machine monitoring focuses on individual equipment health — fault codes, temperatures, cycle speeds. Production monitoring takes a plant-level view, combining data from multiple machines and operators to evaluate overall output, quality, and efficiency across lines or shifts. Both serve different decision-making needs.
What KPIs should a real-time production monitoring system track?
Core metrics: OEE (Availability, Performance, Quality), cycle time vs. target, reject/scrap rate, unplanned downtime frequency and duration, and throughput vs. planned output. Injection molding operations should also track shot count per press and take-out robot cycle confirmation — especially on high-speed, high-cavitation cells.
How does real-time monitoring support lights-out manufacturing?
In lights-out or minimally staffed operations, automated alerts replace human observation. When a machine stops or a threshold is breached, the system immediately notifies a remote operator or on-call technician, enabling rapid response with no one on the floor. Yushin's YC Email Notification Module and INTU LINE IoT are both designed for this use case.